
Android GPU Debugging
![]() I am currently working on improving the custom Vulkan renderer that powers PeakVisor’s Android app. It is one of the key features that sets the app apart from other mountain route-planning applications, enabling highly accurate 3D maps and augmented-reality (AR) peak identification. However, building a custom renderer also comes with unique challenges. Addressing performance issues and rendering bugs often requires GPU profiling and debugging, and on Android, determining which tools are appropriate for these tasks is not immediately obvious.
I am currently working on improving the custom Vulkan renderer that powers PeakVisor’s Android app. It is one of the key features that sets the app apart from other mountain route-planning applications, enabling highly accurate 3D maps and augmented-reality (AR) peak identification. However, building a custom renderer also comes with unique challenges. Addressing performance issues and rendering bugs often requires GPU profiling and debugging, and on Android, determining which tools are appropriate for these tasks is not immediately obvious.
On Windows, I have successfully used NVIDIA Nsight, Baldur Karlsson’s RenderDoc, and Microsoft’s PIX. Those tools all have different strengths and weaknesses. I think, I actually like RenderDoc best for ordinary GPU debugging sessions. However, there are some issues with respect to ray tracing support, so it was sometimes necessary to use NVIDIA Nsight instead. Sometimes, both of these tools would crash during graphics debugging, but PIX didn’t. I.e., as developer it can be useful to juggle between different tools.
But how to best do GPU profiling and debugging on Android?
This post contains concrete recommendations on which GPU profiling and debugging applications to use. It covers:
TL;DR: Jump directly to section Conclusion.
Android GPU Inspector and How to Uninstall it
This is a shame, because this tool looks like the perfect tool for Android GPU debugging. However, it always crashed the app that I wanted to debug and worse, it left my Android device in a state so that the app would now always crash with a segmentation fault, even when not being debugged. Therefore, this section is mainly an uninstall guide because uninstalling wasn’t straight-forward. And without removing everything that Android GPU Inspector leaves on the Android device, your app might never run again on that device.
Android GPU Inspector installs an interceptor layer as an app called “GAPID” to capture GPU calls.
Install Instructions:
- Download and install the Android GPU Inspector
- Connect an Android device via USB and ensure that USB Debugging is enabled
- Start the Android GPU Inspector
- On the connected Android device, you will be asked to install the “harmfull”
GAPID - arm64v8a, which you have toInstall anyway - Capture a new trace via Android GPU Inspector:
- As soon as the device has been successfully connected and GAPID has been installed, you’ll be able to select your
Device - Then, you’ll also be able to select an
Applicationto GPU-debug via the...-button.
- As soon as the device has been successfully connected and GAPID has been installed, you’ll be able to select your
- If you’re lucky, you can do GPU debugging. If you’re not, the Android device might be configured in a way that your app never runs again.
Uninstall Instructions:
- Uninstall
GAPID - arm64v8afrom Settings -> Apps - Execute in a terminal:
adb shell settings delete global gpu_debug_layersIf successful, you should see the following message printed to the console:
Deleted 1 rows.
These should be the most important steps to get Android GPU Inspector off of your app.
For a clean state, also perform the following actions:
- If any of these statements:
adb shell settings get global enable_gpu_debug_layers
adb shell settings get global gpu_debug_app
return something other than
nullor0, execute these respective cleanup statements:adb shell settings delete global enable_gpu_debug_layers adb shell settings delete global gpu_debug_app - If these statement:
adb shell ls /data/local/tmp/lists entries connected to the Android GPU Inspector, delete them:
adb shell rm /data/local/tmp/agi_launch_producer
adb shell rm /data/local/tmp/agi_launch_producer.pid
RenderDoc
Good old RenderDoc by Baldur Karlsson can be used for GPU debugging on Android. Similar to Android GPU Inspector, it installs an interceptor layer on the phone: an app called “RenderDocCmd”. While I got an impression of RenderDoc being slightly outdated in terms of Android support, I could successfully use it for GPU debugging. RenderDoc is run on the PC and connects to a so-called Remote Context—namely a Debug-enabled Android device, as described on RenderDoc’s How do I use RenderDoc on Android? page. How to connect to an Android device as Remote Context is shown in Figure 1. Connecting starts RenderDocCmd on the Android device which communicates with RenderDoc.
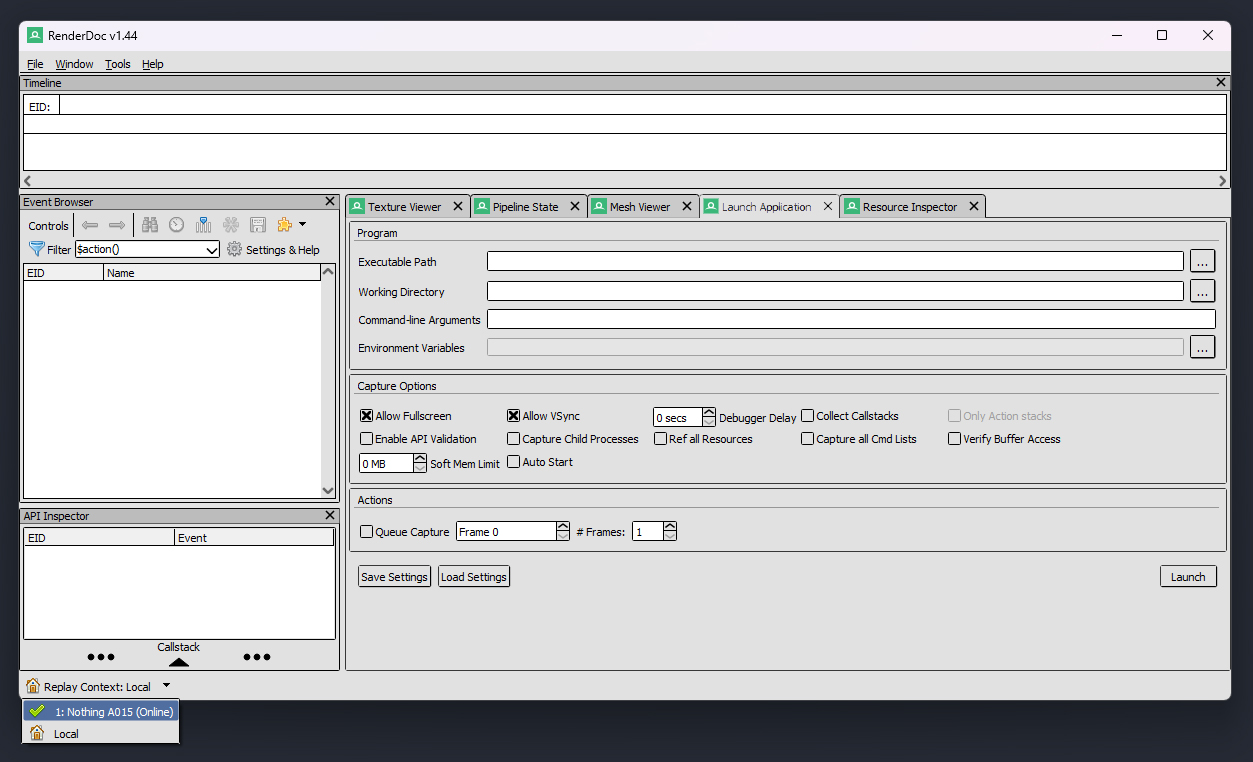
Figure 1: Connecting to Remote Context or Replay Context through RenderDoc (see bottom-left).
After establishing this connection, RenderDoc provides a list of Android application package names (those com.application.my-type ones) which can be selected through the ...-menu next to the Executable Path textbox. This looks like shown in Figure 2 and once the to-be-debugged application has been selected, GPU debugging can be Launched.
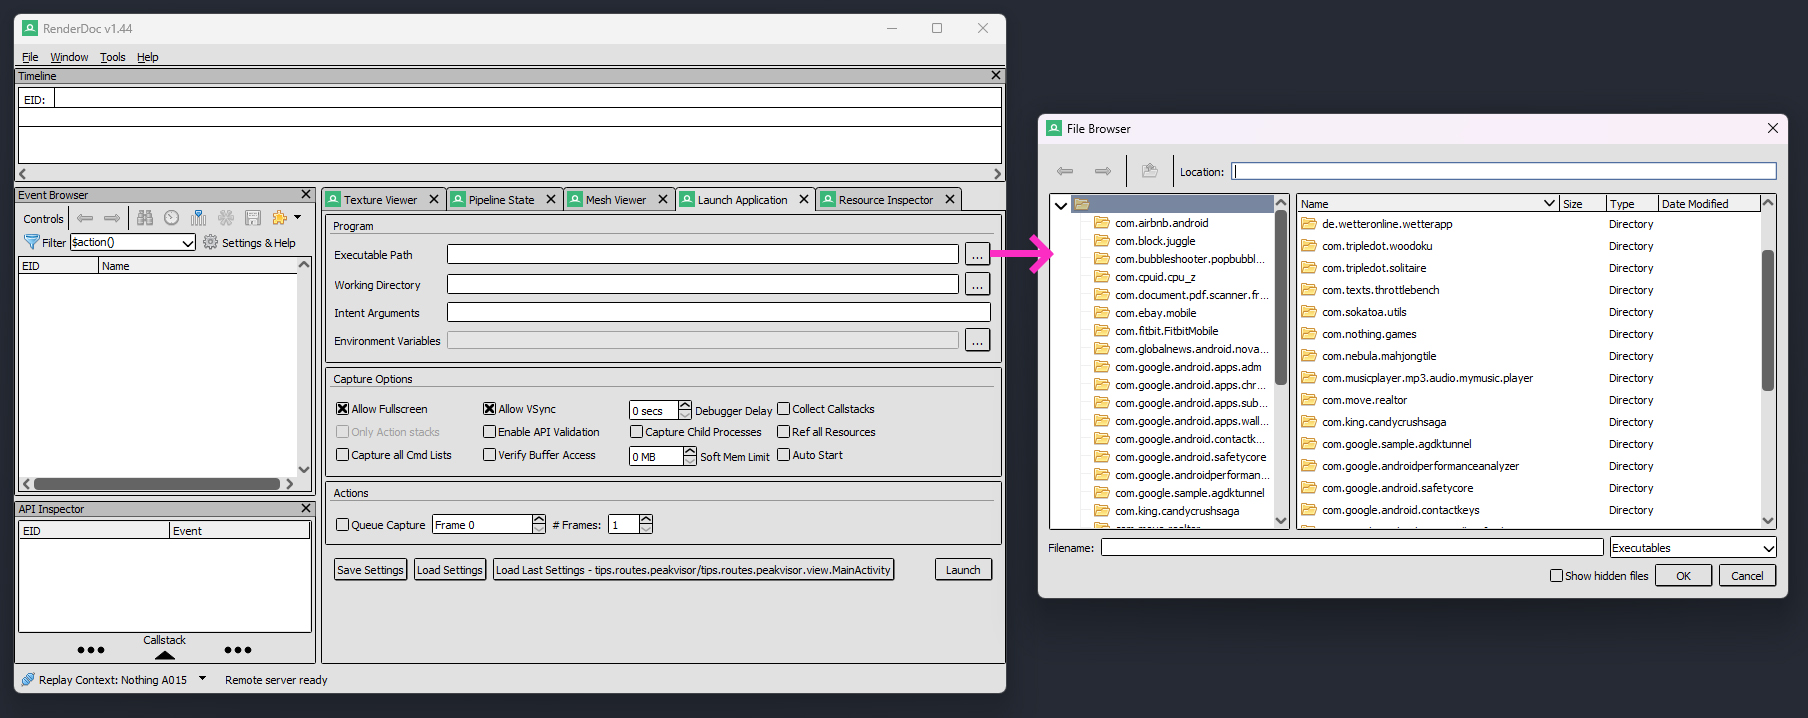
Figure 2: Selecting an Android app which is present on the connected phone for GPU debugging.
The rest is pretty much the typical RenderDoc profiling and debugging experience—which is awesome if it works. However, also in typical RenderDoc manner, RenderDoc sometimes crashes. Be it that the app is using exotic features, or features code that can lead to undefined behavior, it can be challenging to find the root cause.
Perfetto and Its Online Trace Viewer
Perfetto seems to be the standard system-wide profiling layer on Android nowadays, which offers support for GPU profiling among all kinds of other profiling areas. GPU profiling seems to somewhat limited with respect to the other solutions presented above when using the online Trace Viewer, but there’s a new tool by Samsung which might indicate otherwise (more information about that in the next section about Sokatoa).
Citing the Perfetto DOCS (available at perfetto.dev/docs),
Perfetto is the default tracing system for the Android operating system
so nothing has to be installed on the Android device—at least on newer devices, since Perfetto is
Part of the platform since Android 9 Pie.
Most interestingly, there is a browser-based tool to record and view traces, namely Perfetto’s Trace Viewer.
Its menu item Record new trace allows to connect to a device (it will ask for permission to Sign in as “WebUSB ADB Key”) once you hit the ▶ button.
- Connect to a target device under Overview
- Focus on a specific package name under Android apps & svcs
- Configure which data to capture, such as settings for GPU-specific probes under GPU
- Start profiling with the ▶ button, and stop it with the ■ button.
- The trace will open directly in the browser, showing the measurements. A Perfetto trace can look like shown in Figure 3.
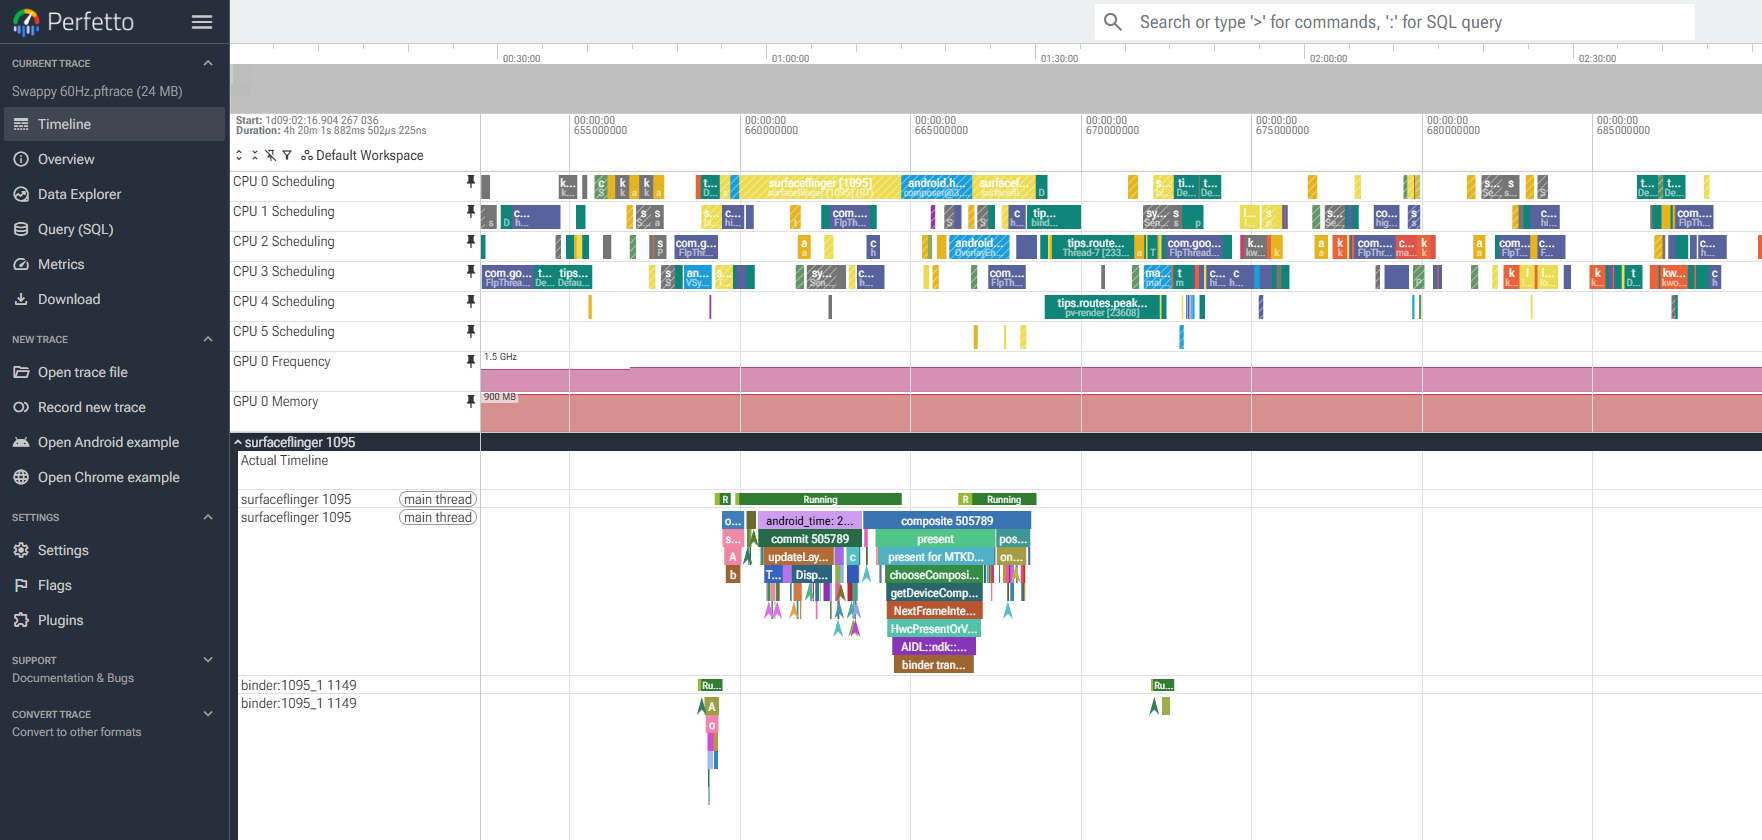
Figure 3: A Perfetto trace, showing approximately one frame. The surfaceflinger section gives some insights of the work done on the GPU.
In terms of GPU debugging, the Perfetto DOCS point out the Trace Viewer’s limited support for GPU debuging information:
We have some support for GPU render stages and GPU counters recording on Android, but these features are better supported by Android GPU Inspector (which under the hoods uses Perfetto as one of its data sources).
However, I really disagree with their recommendation of Android GPU Inspector, as described above. There is a much better option. 👇
Sokatoa
In short, Sokatoa v1.0.0 is what I expected Android GPU Inspector to be. Its v1.0.0 has only recently been released—in March 2026—followed by v1.0.1 in May 2026.
It is developed by the Samsung Austin Research Center but is by no means limited to Samsung devices. Instead, it is a vendor-neutral GPU profiler and debugger. I’ve successfully used it to debug apps running on Adreno and Mali GPUs, on Samsung and non-Samsung devices. The debugging experience was overall pretty smooth and the tool was very stable. Not all features are as user friendly as they could be (yet), but there is a Discord server where one can get in contact with the developers, which are very active and open to feedback. Overall, my experience with it was pretty awesome and I cannot wait for seeing future upgrades to the tool.
Releases, installation instructions, and a link to the Discord server are available on Sokatoa’s GitHub site.
From a technical point, Sokatoa interfaces with Perfetto and uses LunarG’s GFXReconstruct. Figure 4 shows its interface. Sokatoa offers much better control and insights than Perfetto’s Trace Viewer. In parts, it is even on par with RenderDoc. In general though, RenderDoc offers more features and maybe more data insights—it is a battle-tested and time-proven tool after all. However, in terms of stability Sokatoa left a better impression, which is remarkable for a v1.0.1.
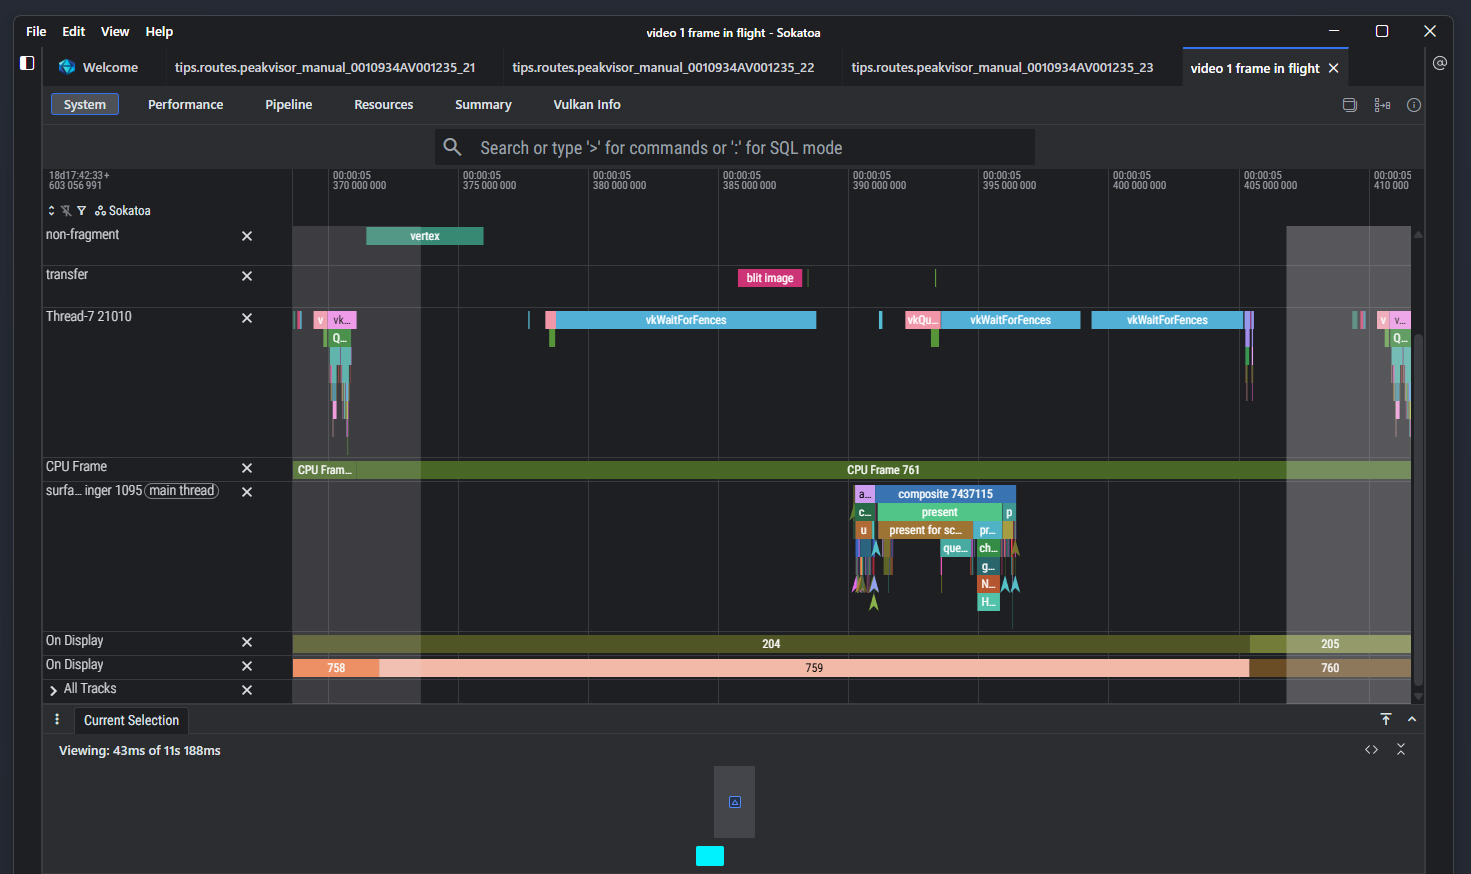
Figure 4: A bit more than one frame in Sokatoa. The viewed frame has black background, while previous and next frames have gray backgrounds. The “Current Selection” tab at the bottom should actually show the frame’s rendering output. However, the app which was debugged uses the Vulkan extension VK_EXT_layer_settings which was not supported by Sokatoa v1.0.1 and led to frames not being shown. Preparing a build with this Vulkan extension omitted can serve as a workaround to fix this issue for now.
Conclusion
My recommendations for GPU profiling and debugging tools on Android are straight forward:
Comments